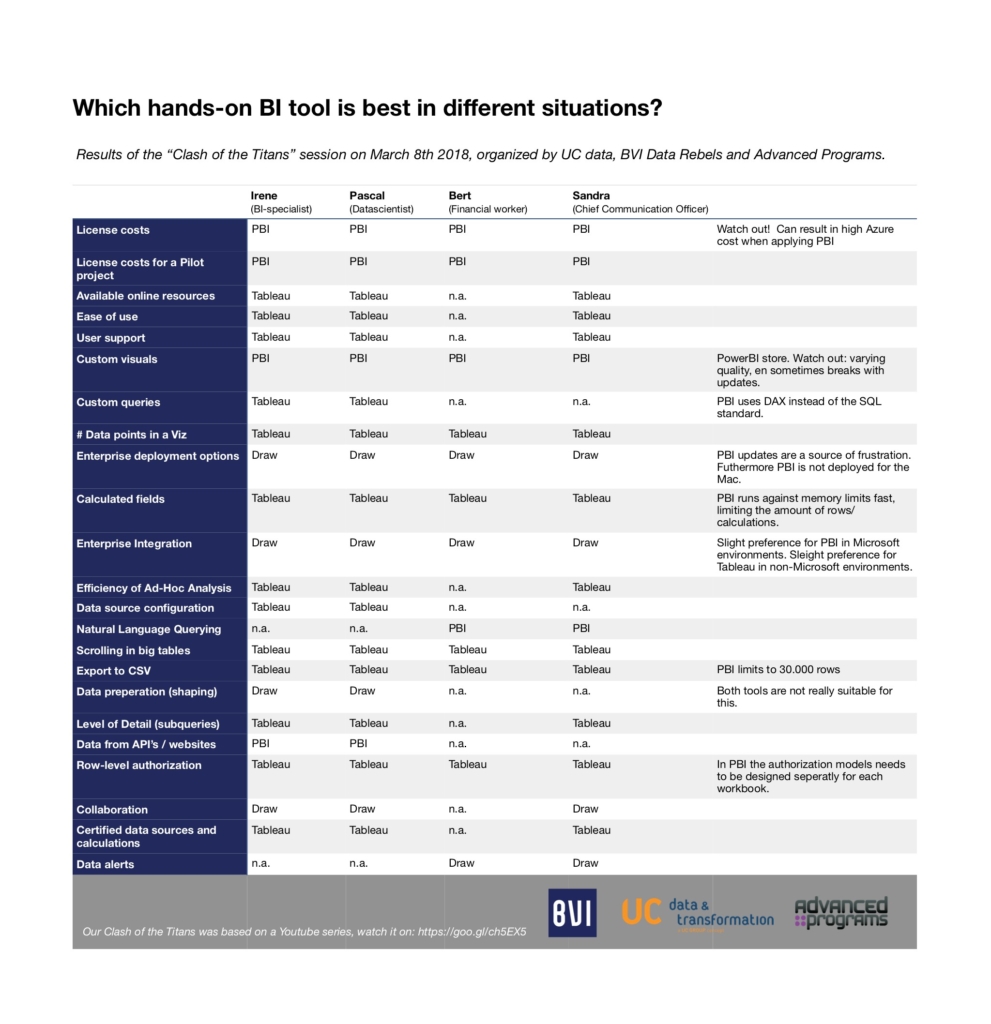
On the 8 of March 2018 – together with UC Data – we invited several BI specialists to gain more insight into the differences and similarities between Power BI and Tableau. The session was based on an excellent Youtube series: “Clash of the Titans” (https://goo.gl/ch5EX5) by Joni Girardi.
Today we present to you the results. As could be expected we found many similarities between these two well-known hands-on BI tools. Both allow the user to load and filter data, make custom graphs/views, put them together in an interactive dashboard etc. Additionally, in the more advanced settings we found a high resemblance as well, e.g. both allow the user to set a threshold data alert by email and both have similar deployment options.
However, there are also some clear wins on either side. Power BI is extremely easy to implement in Microsoft environments, uses natural language query in search bars and has more freedom in generating customs visuals. Also: the license costs per-user are lower, which could be a tie-breaker in some situations!
We found that the Tableau platform has a higher maturity level resulting in a better community and issue resolving. Furthermore, a big difference and a clear win for Tableau is the fact that PowerBI limits the amount of data points in your view (especially risky in scatter plots) and makes custom calculations almost impossible. Ad-hoc custom calculations are very strong in Tableau and a clear advantage.
The most stunning factor for us was the difference in speed of analysis. Tableau helps users get to answers 25% faster! In the YouTube series of Joni, watch movie 8 “Ad Hoc Analysis” to get a feel for what this means. Think of two bikes, and one goes 25% faster. Imagine how much more of the world you can explore in the same time on the faster bike!
Overall conclusions: Both are excellent tools. Are you coming from a Microsoft environment, looking for a BI tool to make custom detailed dashboards by experts which are consumed by your users then Power BI might be your pick. Are you looking for a business-usable tool to do efficient hands-on analyses, then you can’t beat Tableau!
Interested in the details of our findings? We’d love to talk to you about it, just drop us a line at: team-bads@advancedprograms.nl .

