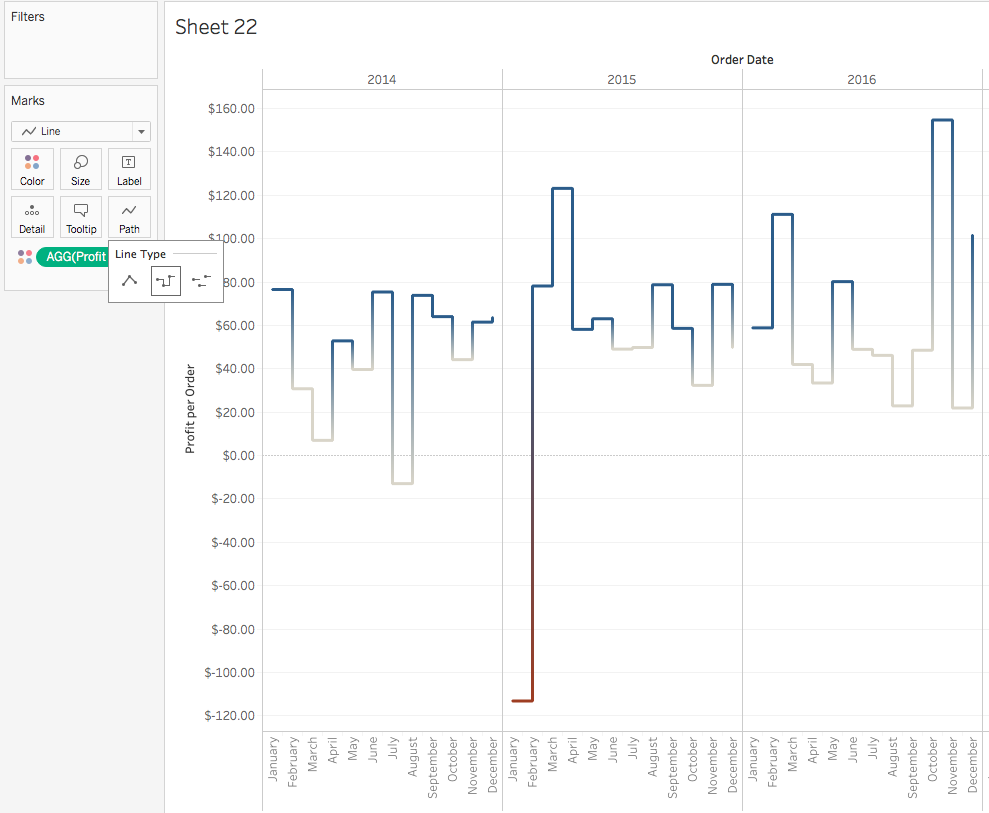
Recently Tableau launched the newest version of their software: Tableau 2018.1. In this news item we will briefly cover our favourite new features and improvements, for more detailed information visit: https://www.tableau.com/products/new-features.
As many of you may know, Tableau highly appreciates the contributions of the active Tableau community, resulting in various interesting software improvements. To add a suggestion or vote click here. In this new version, improvement efforts were focussed on adding the hierarchy in filters, making filtering easier for the end user. Furthermore, they made clustering more dynamic, improved viz in tooltip, added analytical object guidance, added a direct connection to SQL spatial data and much more.
Do you want some more information? or you looking for more guidance in Tableau? Feel free to drop us a line at: team-bads@advancedprograms.nl.

